Screenshots
App support and contact
Please email ecg-recorder [ a t ] cmdline [ d o t ] net with all questions and comments. Or open an issue on GitHub.
Note on Apple Health Support
Currently, Apple does not allow the writing of ECG data to Apple Health (with the exception of ECG data recorded with the Apple Watch). Hence, I am not able to add this functionality. HR and RR data could be written to Apple Health so, I might add this feature in the future on request.
Demo videos
Have a look at the demo videos on how to convert the data into Numbers or EDFbrowser.
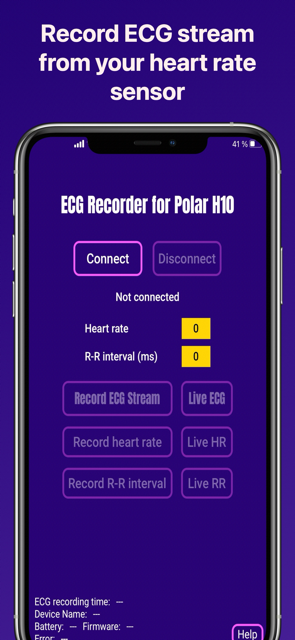
How does this app work?
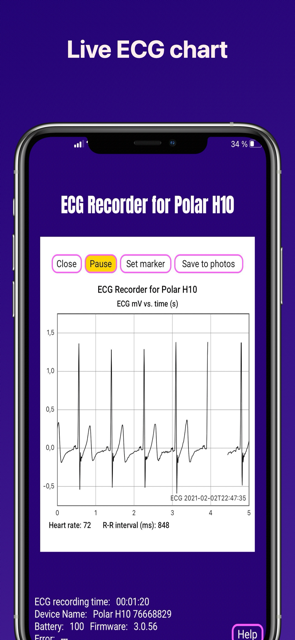
This App records three types of data from a Polar H10 heart rate sensor: electrocardiogram (ECG), heart rate (HR) and the R-R interval (RR). Minimum firmware of the H10 for ECG to work is 3.0.35. Each type of data can also be displayed in a real time chart. Screenshots of the real time chart can be taken via the “save to photos” button. A video of the live chart can be recorded using the iOS screen recorder button from the iOS Control Center (maybe needs to be enabled via Settings —> Control Center).
If the user has an active subscription “Enable premium features” (IN-APP purchase), all data is saved to the ECG Recorder App’s directory in the “Files” app, the file name being the timestamp when the recording started. All data is saved as an ascii text file. The text files contain one value per line and should be easily imported into other software for data processing. In addition, the premium features include live / real-time charts of ECG, HR, and RR.
ECG DATA
According to specifications ECG data is collected at a rate of 130 Hz (my device works at 130.061 Hz) in microvolts (µV). That means that there is one value every 7.692 milliseconds (ms). For 10 minutes recording that is 78000 values. When importing the data into e.g. Microsoft Excel or Apple Numbers, you will receive one long column of µV values. You can divide all values by 1000 to receive millivolts (mV). You will need to create yourself a time column as well to be able to properly plot the data. If the time column shall be in seconds, it should have as values 0.007692, 0.015385, 0.023077, 0.030769, …. With that time column as X and the mV as Y you can plot a mV vs. seconds ECG. The “Set marker” button in the ECG live chart adds a value of 2000 µV to the data. This value can be easily seen in a graph or found by searching through the data.
The open source software EDFbrowser can convert the ascii text files into .edf files which can be nicely browsed using the software. Some sample ECG data and demo videos for import into Apple Numbers and EDFBrowser are available.
HR DATA
There is about one value for HR (average beats per minute, bpm) recorded per second. In case you want to plot the data you will need to create a time column with 1, 2, 3, 4, … seconds and so forth.
RR DATA
The RR interval is the time elapsed between two successive R-waves of the QRS signal on the electrocardiogram (the reciprocal is the HR). The RR intervals are recorded in ms.
TERMS OF SERVICE
Please note: This app is for informational purpose only. Use of the app and site is not intended to be a substitute for professional medical advice and you should promptly contact your own health care and/or provider regarding any medical conditions or medical questions that you have. THE APP AND WEB SITE DO NOT OFFER MEDICAL ADVICE, AND NOTHING CONTAINED IN THE CONTENT IS INTENDED TO CONSTITUTE PROFESSIONAL ADVICE FOR MEDICAL DIAGNOSIS OR TREATMENT.
Why did I make this app?
I am a passionate runner and was looking for a heart rate monitor for sports application. I came across the Polar H10 and was intrigued by the possibility to obtain real ECG data from this device. To my surprise in late 2019 there was no iOS app on the App Store which offered recording or displaying of the data. There was one exception, but it was quite costly and not clear what was offered. Since I saw no other options and Polar provides a very good SDK vor the H10, I decided to develop my own app.
Why an app with subscriptions?
It turned out very soon that development of this app will consume a significant amount of time and in the end also costed money. I hope that the small fee asked will compensate a little bit for the invested time and money.
The app is free to download to get a first impression and connect to a device. It is possible to see a few seconds of the live charts. To activate the premium features, please make one of the available IN-APP purchases. Each subscription has a one week free trial, so all features can be tried free of charge. I found that a model of subscriptions of various durations with a one week free trial will be the most fair. It is also possible to do a one time payment without any recurring subscriptions.
This App uses the excellent Purchase and PolarBle SDKs.
Note: The German versions of the Impressum and the Privacy Policy are the legally binding versions.